ER 图是实体-关系图(Entity-Relationship Diagram)的简称,它是一种更简单、直观的图形化描述数据表实体及表之间关系的模型,有助于架构师从整体高层次概览数据库表的属性和关系,以便更好地进行数据库设计和优化。
初始页面布局算法
E-R 图的元素主要有:实体、属性、关系、连接线、主键等,其中页面整体布局样式由实体也就是 table 表布局来呈现,由于每个数据库中的表属性个数不一,且不同长度的表交错排布,使得页面有较多空白,为了提高页面利用率,选用瀑布流算法初始化 E-R 图排版,使得整体页面根据当前页面宽度和每个实体宽度来调整列的个数,从而自适应布局,节省整个页面空间。 瀑布流算法描述:
- 首先计算一行能够容纳几列元素(自适应列数)
- 找出第一列元素中高度最小一列,将待插入的表显示在上一行最短的表下面。
- 继续计算所有列中高度之和最小的那一列,然后继续将新元素添加至高度之和最小的那一列后面,直至所有元素添加完毕。 关键代码:
//瀑布流布局
const drawerRect = document
.querySelector('#container')
?.getBoundingClientRect()
const pageWidth: number = drawerRect?.width || 0
let columnFloat = pageWidth / (NODE_WIDTH + NODE_OFFSET)
//NODE_WIDTH 每个元素宽度
let columns = parseInt(columnFloat.toString())
// 记录上一行每个元素的 x,y,h
let minChildArray: Array<number> = []
data.forEach((table: ApiDataStructure.ERDataTable, index: number) => {
let xRes = 0
let yRes = 0
if (index < columns) {
xRes = (NODE_WIDTH + NODE_OFFSET) * index
yRes = 0
//将第一行元素的高度存入数组中
minChildArray.push(table.children.length * LINE_HEIGHT + 24)
} else {
//其他行先找出最小高度和索引
let minHeight = minChildArray[0]
let minIndex = 0
if (minChildArray.length) {
for (let i = 0; i < minChildArray.length; i++) {
if (minHeight > minChildArray[i]) {
minHeight = minChildArray[i]
minIndex = i
}
}
}
//设置下一行的第一个盒子位置
xRes = minIndex * (NODE_WIDTH + NODE_OFFSET)
yRes = minHeight + 24
minChildArray[minIndex] =
minChildArray[minIndex] +
table.children.length * LINE_HEIGHT +
24 +
24
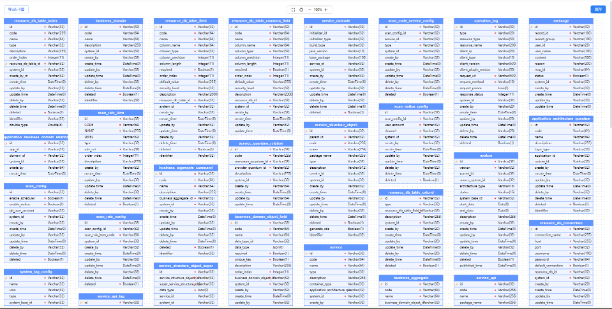
}大数据量 demo 测试效果:
连线关系
常见的实体属性之间的关系包含一对一、一对多和多对多关系,使用箭头来表示基数。在 antV 中,没有内置连线关系。此处,根据 E-R 图规范的连线,自定义一对一、一对多和多对多连线。
连线关系思路:
- antV 中注册自定义线型 Marker:根据一对一连线、一对多连线、多对多连线定制三种线型。
- 根据实体属性关系,使用自定义线型连线。
连线的关键代码:
{
id: Math.random() + '',
shape: 'edge', //注册的自定义线名称
source: {
cell: '0acb482c71b47cd1f0be40787b8e9630', //源实体 id
port: '227cea20d3d049084b2a22d1a809b26b' //源实体属性
},
target: {
cell: '0d3865dbeeb8ca406a650fc8651fe381', //目标实体 id
port: '35e0bb7c7e2b29baae2ea370b8350eb0' //目标实体属性
},
labels: ['1:n'], //关系:1 对多/1 对 1/多对多
attrs: {
line: {
stroke: '#A2B1C3',
strokeWidth: 2
}
},
zIndex: 0
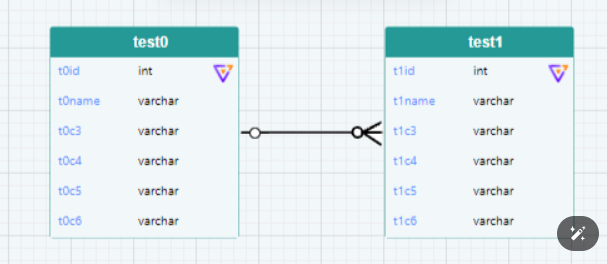
}demo 测试效果:
主键和必填项标注
主键即该实体类的唯一标识,通过后端返回数据格式中 primaryKey 和 required 来标识主键和必填属性。 1)定义页面所需的节点/边的结构。
{
  markup: [
    {
      tagName: 'rect', //类型为 rect 节点
      selector: 'body', //名称
    },
    {
      tagName: 'text', //类型为文本
      selector: 'label', //名称
    },
    { tagName: 'image', selector: 'primaryKey' }, //标识主键的图标
    { tagName: 'image', selector: 'required' } //标识必填项的图标
  ],
   attrs: {
    primaryKey:{
     ref: 'img',
       x: 158, //x 轴坐标
       y: 8, //y 轴坐标
   width: 7, //图标宽度
  height: 7, //高度
xlink:href: '' //图标 url
    }, //主键图标样式
    required:{} //必填图标样式
  }
}
antV 中,通过 markup 定义的节点/边为所有实例共享。当加载后端不同的数据修改 markup 时,触发 change:markup 事件和画布重绘。
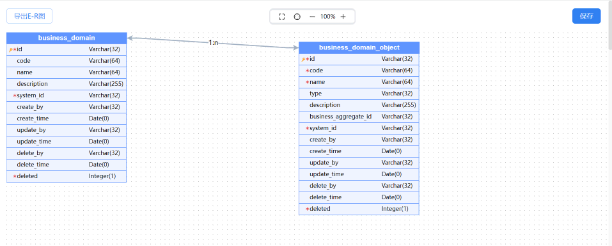
demo 测试效果:
拖动保存和渲染
- 通过调用 graph.toJSON( )方法来导出整个画布的数据,从而将节点/边的结构化数据转换为 JSON 数据,以便做持久化存储。 toJSON(options?: Cell.ToJSONOptions): Object
- 当 options.diff 为 false 时,返回完整数据。
- 当 options.diff 为 true 时,返回差异数据。
- 将编排保存后的的数据转换为节点和边在页面渲染。
fromJSON(
  data: {
    cells?: (Node.Metadata | Edge.Metadata)[], //Node 和 Edge 的基类,包含
    //节点和边的通用属性和方法定义,如属性样式、可见性、业务数据等
    nodes?: Node.Metadata[], //节点
    edges?: Edge.Metadata[], //边
  },
  options?: FromJSONOptions, //支持的操作配置项
): this
如上 fromJSON 方法的入参 data,包含 cells、nodes、edges 元数据数组,通过该方法可按照数组顺序将保存的 JSON 二次渲染。
定制 vue 节点
x6 的内置图样式不能灵活更改,为了自定义节点样式,定制 vue 组件节点来渲染节点内容,安装独立的@antv/x6-vue-shape 包来使用 Vue 组件渲染节点。 父组件中:
import ERGraph from './components/ERGraph/index.vue'
<ERGraph
            :downloadAble="hasDiagramReadPermission"
            :saveAble="hasDiagramUpdatePermission"
            :resourceDbId="cacheResourceDbId"
            :resourceDbName="schemaName"
            :sourceData="sourceData"
            :relationData="relationData"
            class="p-1 flex-1 h-full overflow-hidden"
          >
 </ERGraph>
ERGraph 组件结构
├── ERGraph
│   ├── components
│   │       └── ErGraphSetting.vue
│   │── entity
│   │       ├── index.vue
│   │── index.vue
│   │── teleport.ts
ErGraphSetting.vue
<script setup lang="ts">
import { ref, watch, onMounted } from 'vue'
import { ElMessage, FormInstance } from '@gcommon/gcommon-ui'
import {
  getErConfig,
  createErConfig,
  updateErConfig
} from '@/services/api/data-structure'
// import { queryDictByCodes } from '@/services/api/common'
const props = defineProps<{
  show: boolean
  resourceDbId: string
}>()

const loading = ref(false)
const defaultSetting: ApiDataStructure.ErGraphSetting = {
  titleDisplay: 'only_tableName', //表头显示
  fieldDisplay: 'only_columnName', //字段显示
  fieldNumDisplay: 'default_10_first' //字段显示数量
}
const setting = ref<ApiDataStructure.ErGraphSetting>({
  ...defaultSetting
})
const erGraphSettingRef = ref<FormInstance>()
const emits = defineEmits<{
  (k: 'update:show', v: boolean): void
  (k: 'save', v: ApiDataStructure.ErGraphSetting): void
}>()
const handleClosed = () => {
  setting.value = defaultSetting
}
const id = ref('')
const handleConfirm = async () => {
  try {
    if (!id.value) {
      const data = Object.assign({}, setting.value, {
        resourceDbId: props.resourceDbId
      })
      const res = await createErConfig(data)
      console.log(res, 'res')
      if (!res.data) {
        ElMessage.error('保存失败!')
        return
      }
      id.value = res.data
    } else {
      const data = Object.assign({}, setting.value, {
        resourceDbId: props.resourceDbId,
        id: id.value
      })
      const res = await updateErConfig(data)
      if (!res.data) {
        ElMessage.error('保存失败!')
        return
      }
    }
    ElMessage.success('保存成功!')
    emits('save', setting.value)
  } catch (error) {
    console.log(error, 'error')
  }
}
const handleUpdateShow = (v: boolean) => {
  emits('update:show', v)
}
const dict = {
  erFieldNumDisplay: [
    {
      name: '默认展开显示前10个字段',
      value: 'default_10_first',
      children: []
    },
    {
      name: '默认展示显示所有字段',
      value: 'both_all',
      children: []
    }
  ],
  erFieldDisplay: [
    {
      name: '仅显示字段名',
      value: 'only_columnName',
      children: []
    },
    {
      name: '仅显示“显示名称”',
      value: 'only_description',
      children: []
    },
    {
      name: '两者都显示',
      value: 'both_two',
      children: []
    }
  ],
  erTitleDisplay: [
    {
      name: '仅显示“表名”',
      value: 'only_tableName',
      children: []
    },
    {
      name: '仅显示“显示名称”',
      value: 'only_description',
      children: []
    },
    {
      name: '两者都显示',
      value: 'both_two',
      children: []
    }
  ]
}
watch(
  () => props.show,
  async () => {
    // const res = await queryDictByCodes(types.join(','))
    // dict.value = res.data
    const { data } = await getErConfig(props.resourceDbId)
    id.value = data?.id
    setting.value.fieldNumDisplay =
      (data?.fieldNumDisplay as 'default_10_first' | 'both_all') ||
      'default_10_first'
    setting.value.titleDisplay =
      (data?.titleDisplay as
        | 'both_two'
        | 'only_tableName'
        | 'only_description') || 'only_tableName'
    setting.value.fieldDisplay =
      (data?.fieldDisplay as
        | 'both_two'
        | 'only_description'
        | 'only_columnName') || 'only_columnName'
  }
)
</script>

<template>
  <el-dialog
    width="800"
    title="显示设置"
    destroy-on-close
    :modelValue="show"
    @update:modelValue="handleUpdateShow"
    :close-on-click-modal="false"
    :close-on-press-escape="false"
    @closed="handleClosed"
  >
    <div>
      <el-form
        ref="erGraphSettingRef"
        class="service-form"
        :model="setting"
        label-position="top"
      >
        <el-form-item label="表头显示" prop="titleDisplay">
          <el-radio-group v-model="setting.titleDisplay">
            <el-radio
              v-for="item in dict.erTitleDisplay"
              :label="item.value"
              :key="item.value"
              >{{ item.name }}</el-radio
            >
          </el-radio-group>
        </el-form-item>
        <el-form-item label="字段显示" prop="fieldDisplay">
          <el-radio-group v-model="setting.fieldDisplay">
            <el-radio
              v-for="item in dict.erFieldDisplay"
              :label="item.value"
              :key="item.value"
              >{{ item.name }}</el-radio
            >
          </el-radio-group>
        </el-form-item>
        <el-form-item label="字段显示数量" prop="fieldNumDisplay">
          <el-radio-group v-model="setting.fieldNumDisplay">
            <el-radio
              v-for="item in dict.erFieldNumDisplay"
              :label="item.value"
              :key="item.value"
              >{{ item.name }}</el-radio
            >
          </el-radio-group>
        </el-form-item>
      </el-form>
    </div>
    <template #footer>
      <span class="dialog-footer">
        <el-button @click="handleUpdateShow(false)">取消</el-button>
        <el-button type="primary" :loading="loading" @click="handleConfirm"
          >确定</el-button
        >
      </span>
    </template>
  </el-dialog>
</template>
Entity/index.vue
<template>
  <div class="of-ergraph-group" :style="{ '--tab-h': compHeight + 'px' }">
    <div class="ergraph-group-header" :title="headDesc">
      {{ headDesc }}
    </div>
    <ul class="ergraph-group-list">
      <li v-for="property in renderEntity?.children" :key="property?.columnId">
        <div class="ergraph-group-tips">
          {{ property?.columnType }}
          <span
            v-if="
              property?.columnType !== 'Boolean' && property?.columnLength !== 0
            "
          >
            ({{ property?.columnLength }})
          </span>
        </div>
        <div class="ergraph-group-text">
          <span>
            <el-icon
              v-if="property?.primaryKey"
              class="primaryImg icon-require"
            >
              <KeyIcon />
            </el-icon>
            <el-icon v-else-if="property?.required" class="primaryImg">
              <RequireIcon />
            </el-icon>
            <span v-else class="primaryImg"></span>
          </span>
          <span :title="getField(property)" class="field">
            {{ getField(property) }}
          </span>
        </div>
        <div></div>
      </li>
      <li
        v-show="
          !showAll &&
          !showRemaining &&
          renmainingEntity &&
          renmainingEntity.children.length > 0
        "
        @click.stop="toggleExpand"
        class="more-btn"
      >
        <span class="pl-4">{{
          `${showRemaining ? '隐藏' : '显示'}更多字段(${
            (data?.children.length || 0) - (renderEntity?.children.length || 0)
          })`
        }}</span>
      </li>
      <div v-if="!showAll && showRemaining">
        <li
          v-for="property in renmainingEntity?.children"
          :key="property?.columnId"
        >
          <div class="ergraph-group-tips">
            {{ property?.columnType }}
            <span
              v-if="
                property?.columnType !== 'Boolean' &&
                property?.columnLength !== 0
              "
            >
              ({{ property?.columnLength }})
            </span>
          </div>
          <div class="ergraph-group-text">
            <span>
              <el-icon
                v-if="property?.primaryKey"
                class="primaryImg icon-require"
              >
                <KeyIcon />
              </el-icon>
              <el-icon v-else-if="property?.required" class="primaryImg">
                <RequireIcon />
              </el-icon>
              <span v-else class="primaryImg"></span>
            </span>
            <span :title="property?.columnName" class="field">
              {{ getField(property) }}
            </span>
          </div>
          <div></div>
        </li>
      </div>
    </ul>
  </div>
</template>

<script setup lang="ts">
import RequireIcon from '@/assets/img/xinghao.svg'
import KeyIcon from '@/assets/img/key.svg'
import { inject, computed, ref, onMounted, watch, unref } from 'vue'
import { Node } from '@antv/x6'
import { emiter } from '@/utils/emiter'
import { ElIcon } from '@gcommon/gcommon-ui'

const LINE_HEIGHT = 30
const LIMIT = 10
const NODE_WIDTH = 234

const getNode: Function | undefined = inject<Function>('getNode')
// 自定义节点传进来的数据
const data = ref<ApiDataStructure.ErEntity | undefined>(undefined)

const showAll = computed(
  () => data.value?.setting.fieldNumDisplay === 'both_all'
) // 是否显示全部字段// 是否显示全部字段
const showRemaining = ref<boolean>(false) // 当不显示全部字段时,是否显示剩余字段
// 实际渲染的字段
const renderEntity = computed<ApiDataStructure.ErEntity | undefined>(() => {
  return showAll.value || !data.value
    ? data.value
    : { ...data.value, children: data.value?.children.slice(0, LIMIT) }
})
// 剩余字段
const renmainingEntity = computed<ApiDataStructure.ErEntity | undefined>(() => {
  return !data.value
    ? data.value
    : {
        ...data.value,
        children: data.value?.children.slice(LIMIT, data.value?.children.length)
      }
})
// 显示更多字段
const toggleExpand = () => {
  showRemaining.value = !showRemaining.value
}
// 根据设置显示内容
const headDesc = computed(() => {
  let name = ''
  switch (data.value?.setting.titleDisplay) {
    case 'both_two':
      name = data.value?.description
        ? `${data.value?.tableName}(${data.value?.description})`
        : `${data.value?.tableName}`
      break
    case 'only_description':
      //descriptionfei显示名称非必填
      name = `${data.value?.description}`
        ? `${data.value?.description}`
        : `${data.value?.tableName}`
      break
    case 'only_tableName':
      name = `${data.value?.tableName}`
      break
    default:
      name = `${data.value?.tableName}`
      break
  }
  return name
})
// 根据设置字段内容
const getField = (property: ApiDataStructure.ERDataColumn) => {
  let name = ''
  switch (data.value?.setting.fieldDisplay) {
    case 'both_two':
      name = property?.description
        ? `${property?.columnName || ''}(${property?.description || ''})`
        : `${property?.columnName || ''}`
      break
    case 'only_description':
      //descriptionfei显示名称非必填
      name = `${property?.description || ''}`
        ? `${property?.description || ''}`
        : `${property?.columnName || ''}`
      break
    case 'only_columnName':
      name = `${property?.columnName || ''}`
      break
    default:
      name = `${property?.columnName || ''}`
      break
  }
  return name
}
// 组件高度和节点高度统一在组件内部设置
const compHeight = computed(() => {
  // 跟v-show保持一致即可
  let count = renderEntity.value?.children.length || 0
  if (
    !showAll.value &&
    !showRemaining.value &&
    renmainingEntity.value &&
    renmainingEntity.value.children.length > 0
  ) {
    count++
  }
  if (!showAll.value && showRemaining.value) {
    const remainChildrenLength = renmainingEntity.value?.children.length || 0
    count += remainChildrenLength
  }

  const height = Math.max(count * LINE_HEIGHT + 60, 120)
  return height
})
watch(
  () => compHeight.value,
  () => {
    const node = getNode?.() as Node
    if (!renderEntity.value?.children.length) return
    // 更新节点尺寸
    node.setSize({
      height: compHeight.value,
      width: NODE_WIDTH + 1
    })
  }
)
onMounted(() => {
  const node = getNode?.() as Node
  data.value = node.data
  node.on('change:data', (val) => {
    console.log('val::', val)
    data.value = {
      ...data.value,
      ...val.current
    } as ApiDataStructure.ErEntity
  })

  console.log(node, 'node')
  // 监听ER_GRAPH_SETTING_UPDATED事件,更新图表设置
  emiter.on(
    'ER_GRAPH_SETTING_UPDATED',

    (newSetting: ApiDataStructure.ErGraphSetting) => {
      console.log(newSetting, 'entity')

      node?.setData({
        ...data.value,
        setting: newSetting
      })
    }
  )
})
</script>
<style lang="scss" scoped>
.of-ergraph-group {
  display: flex;
  flex-direction: column;
  background: #fff;
  width: 100%;
  border-radius: 8px;
  border: 0 solid #1890ff;
  border-top-width: 8px;
  box-shadow: 0 0px 12px 2px rgba(0, 0, 0, 0.1);
  .ergraph-group-header {
    text-align: center;
    padding: 8px 24px;
    font-size: 13px;
    line-height: 20px;
    border-bottom: 1px solid #ddd;
    overflow: hidden; /*超出隐藏*/
    text-overflow: ellipsis; /*文字超出时显示省略号*/
    background-color: rgba(250, 250, 251, 0.8);
    white-space: nowrap;
  }

  .ergraph-group-list {
    flex: 1;
    list-style: none;
    overflow: auto;
    padding: 5px 3px 8px 3px;
    margin: 0;
    overflow: hidden;
    min-height: 80px;
    li {
      font-size: 12px;
      line-height: 16px;
      padding: 5px 5px;
      border-radius: 3px;
      transition: all 0.3s;
      cursor: pointer;

      &:hover {
        background: #f2f6fc;
      }
      &.more-btn {
        border-top: 1px solid var(--el-border-color-light);
        box-sizing: border-box;
        color: var(--el-color-primary);
        line-height: 1.6;
      }

      .ergraph-group-tips {
        float: right;
        margin-left: 10px;
        color: #999;
      }

      .ergraph-group-text {
        display: inline-flex;
        padding-left: 5px;
        width: 120px;
        overflow: hidden;
        text-overflow: ellipsis;
        .primaryImg {
          float: left;
          width: 7px;
          height: 7px;
          margin-right: 5px;
          margin-top: 5px;
        }
        .icon-require {
          margin-top: 2px;
          width: 14px;
          height: 14px;
        }
        .field {
          overflow: hidden; /*超出隐藏*/
          text-overflow: ellipsis; /*文字超出时显示省略号*/
          white-space: nowrap;
        }
      }
    }
  }
}
</style>
index.vue
<template>
  <div
    id="drawer"
    :class="isFullscreen ? 'p-4' : ''"
    class="flex-col overflow-hidden rd-2 app-card flex-1 border-box h-full bgc-fff"
    style="overflow: auto"
  >
    <div class="flex justify-between mb-2">
      <el-button
        type="primary"
        plain
        :loading="downloading"
        @click="exportErmap"
        v-if="downloadAble"
        ><span v-if="downloading"> 导出中..</span>
        <span v-else>导出E-R图</span></el-button
      >
      <Tools
        :scale="scale"
        :is-fullscreen="isFullscreen"
        @onFullScreen="onFullScreen"
        @onZoomFit="onZoomFit"
        @onZoom="onZoom"
        @onZoomOut="onZoomOut"
      ></Tools>
      <div>
        <el-button
          type="primary"
          plain
          @click="hanldeErGroupSetting"
          v-if="!hideSettings"
        >
          显示设置</el-button
        >
        <el-button type="primary" v-if="saveAble" @click="saveErmap">
          保存</el-button
        >
      </div>
    </div>
    <div ref="ergraphWrapper" class="of-ergraph relative" id="ergraphWrapper">
      <div
        id="ergraph-container"
        ref="containerRef"
        class="ergraph-container"
      ></div>
      <div
        v-if="emptyFlag"
        class="empty absolute w-full h-full top-0 left-0 bg-white"
      >
        暂无数据
      </div>
      <TeleportContainer ref="telePortRef" />
      <div id="ergraph-minimap" ref="minimapRef" class="ergraph-minimap"></div>
    </div>
    <ErGraphSetting
      v-model:show="graphSettingDialog.visible"
      :resourceDbId="props.resourceDbId"
      @save="handleSaveSetting"
    />
  </div>
</template>
<script lang="ts" setup>
import { Graph, Cell } from '@antv/x6'
import { Export } from '@antv/x6-plugin-export'
import { ref, onMounted, nextTick, watch, reactive, computed } from 'vue'
import { isNumber } from 'lodash-es'
import screenfull from 'screenfull'
import Tools from './Tools.vue'

import { ElMessage } from '@gcommon/gcommon-ui'
import { useDataStructureStore } from '@/store/modules/data-structure'
import { saveOrUpdateErDiagramApi } from '@/services/api/data-structure'
import { Scroller } from '@antv/x6-plugin-scroller'
import { Snapline } from '@antv/x6-plugin-snapline'
// import { Selection } from '@antv/x6-plugin-selection'
import Entity from './entity/index.vue'
import '@antv/x6-vue-shape'
import { register } from '@antv/x6-vue-shape'
import { getTeleport, reset as resetTeleport } from './teleport'
import arrowByOne from '@/assets/img/arrowByOne.jpg'
import arrowByMany from '@/assets/img/arrowByMany.png'
import { useSystemStore } from '@/store/modules/system'
import ErGraphSetting from './components/ErGraphSetting.vue'
import { emiter } from '@/utils/emiter'
import { getErConfig } from '@/services/api/data-structure'
export interface ErMapProps {
  sourceData: Array<ApiDataStructure.ERDataTable>
  isZoom?: boolean
  relationData: Array<ApiDataStructure.ERDataRelation>
  resourceDbId: string
  saveAble?: boolean
  downloadAble?: boolean
  resourceDbName?: string
  hideSettings?: boolean
}
const props = defineProps<ErMapProps>()

const dataStructureStore = useDataStructureStore()
const LINE_HEIGHT = 30
const NODE_WIDTH = 234
const NODE_OFFSET = 48
const UNFOLD_RENDER_CHILDREN = 10
const LIMIT = 10
const downloading = ref(false)
const graphRef = ref<Graph | null>(null)
const ergraphWrapper = ref<HTMLDivElement | null>(null)
const containerRef = ref<HTMLDivElement | null>(null)
const minimapRef = ref<HTMLDivElement | null>(null)
const telePortRef = ref<HTMLDivElement | null>(null)
register({
  shape: 'custom-vue-node',
  width: 100,
  height: 100,
  component: Entity
})
const TeleportContainer = getTeleport()
const systemStore = useSystemStore()
const emptyFlag = ref(false)
Graph.registerPortLayout(
  'erPortPosition',
  (portsPositionArgs) => {
    return portsPositionArgs.map((_, index) => {
      return {
        position: {
          x: 0,
          y: (index + 1) * LINE_HEIGHT
        },
        angle: 0
      }
    })
  },
  true
)
const initTotalArea = (data: Array<ApiDataStructure.ERDataTable>) => {
  let area = 0
  if (data?.length) {
    data.forEach((table: ApiDataStructure.ERDataTable) => {
      const dynamicHeight = showAll.value
        ? table.children.length * LINE_HEIGHT
        : table.children.slice(0, LIMIT).length * LINE_HEIGHT

      let NODE_HEIGHT = Math.max(dynamicHeight + 60, 120) + NODE_OFFSET

      area += (NODE_WIDTH + NODE_OFFSET) * NODE_HEIGHT
    })
  }
  return area
}

const initSourceData = async (
  graph: Graph,
  cells: Cell[],
  data: Array<ApiDataStructure.ERDataTable>,
  relation: Array<ApiDataStructure.ERDataRelation>,
  pageWidth: number
) => {
  console.log('initSourceData::', data)
  let offsetX = 0
  if (data?.length) {
    let columnFloat = pageWidth / (NODE_WIDTH + NODE_OFFSET)
    //NODE_WIDTH 每个元素宽度
    let columns = parseInt(columnFloat.toString())
    // 记录上一行每个元素的x,y,h
    let minChildArray: Array<number> = []
    data.forEach((table: ApiDataStructure.ERDataTable) => {
      let position = table.tablePosition
        ? JSON.parse(table.tablePosition)
        : null
      let xRes = 0
      let yRes = 0
      if (position?.x) {
        xRes = position?.x
      }
      if (position?.y) {
        yRes = position?.y
      }
      if (!position) {
        if (minChildArray.length < columns) {
          //确定第一元素位置,根据全屏屏幕宽度计算第一个元素位置,使得当前列能全屏展示
          xRes =
            (NODE_WIDTH + NODE_OFFSET) * minChildArray.length + 24 + offsetX
          yRes = 24
          //将第一行元素的高度存入数组中
          minChildArray.push(
            table.children.length * LINE_HEIGHT + NODE_OFFSET + 24
          )
        } else {
          //其他行先找出最小高度和索引
          let minHeight = minChildArray[0]
          let minIndex = 0
          if (minChildArray.length) {
            for (let i = 0; i < minChildArray.length; i++) {
              if (minHeight > minChildArray[i]) {
                minHeight = minChildArray[i]
                minIndex = i
              }
            }
          }
          //设置下一行的第一个盒子位置
          xRes = minIndex * (NODE_WIDTH + NODE_OFFSET) + 24 + offsetX
          yRes = minHeight + 44 + 24
          minChildArray[minIndex] =
            minChildArray[minIndex] +
            table?.children?.length * LINE_HEIGHT +
            NODE_OFFSET * 2 +
            24
          if (60000 - minChildArray[minIndex] < 0) {
            offsetX += columns * (NODE_WIDTH + NODE_OFFSET)
            minChildArray.fill(-NODE_OFFSET)
          }
        }
      }

      const dynamicHeight = showAll.value
        ? table.children.length * LINE_HEIGHT
        : table.children.slice(0, LIMIT).length * LINE_HEIGHT

      let NODE_HEIGHT = Math.max(dynamicHeight + 60, 120)
      console.log(graphSetting, '-----graphSetting')
      const entity: ApiDataStructure.ErEntity = {
        ...table,
        x: xRes,
        y: yRes,
        children: table.children,
        width: NODE_WIDTH,
        setting: graphSetting
      }
      const tableNode: any = {
        id: table.tableId,
        width: NODE_WIDTH + 1,
        height: NODE_HEIGHT,
        x: xRes,
        y: yRes,
        shape: 'custom-vue-node',
        component: {
          template: `<Entity></Entity>`,
          components: {
            Entity
          }
        },
        data: entity
      }
      cells.push(graph.createNode(tableNode))
      //graph.zoomToFit({ padding: 10, maxScale: 1 })
    })
    if (relation?.length > 0) {
      relation.forEach((edge) => {
        const source = {
          cell: edge.resourceDbTableId,
          children: edge.relationTableFieldId
        }
        const target = {
          cell: edge.relationTableId,
          children: edge.relationTableFieldId
        }
        const edgeRelation = {
          source: '',
          target: ''
        }
        if (source && target) {
          if (edge.relationType === 'one_to_many') {
            edgeRelation.source = arrowByOne
            edgeRelation.target = arrowByMany
          } else if (edge.relationType === 'many_to_one') {
            edgeRelation.source = arrowByMany
            edgeRelation.target = arrowByOne
          } else if (edge.relationType === 'one_to_to') {
            edgeRelation.source = arrowByOne
            edgeRelation.target = arrowByOne
          } else {
            edgeRelation.source = arrowByOne
            edgeRelation.target = arrowByOne
          }
          const edgeCell = graph.createEdge({
            id: edge.id,
            shape: 'edge',
            source,
            target,
            background: {
              color: '#f5f5f5'
            },
            grid: {
              visible: true
            },
            attrs: {
              line: {
                stroke: '#999',
                strokeWidth: 2,
                sourceMarker: {
                  tagName: 'image',
                  'xlink:href': edgeRelation.source,
                  width: 12,
                  height: 12,
                  y: -6
                },
                targetMarker: {
                  tagName: 'image',
                  'xlink:href': edgeRelation.target,
                  width: 12,
                  height: 12,
                  y: -6
                }
              }
            }
          })
          cells.push(edgeCell)
        }
      })
    }
  }
}
// 根据设置,计算数据表初始高度
const calcInitHeight = (table: ApiDataStructure.ERDataTable) => {}
// 根据设置,计算初始显示的字段数量
const calcInitChildrenLength = (
  table: ApiDataStructure.ERDataTable,
  setting: ApiDataStructure.ErGraphSetting
) => {
  const children =
    setting.fieldNumDisplay === 'both_all'
      ? table.children
      : table.children.slice(0, UNFOLD_RENDER_CHILDREN)
  return children.length
}

const scale = ref(1)

const initGraph = async () => {
  await nextTick()
  graphRef.value = new Graph({
    container: containerRef.value!,
    autoResize: true,
    /**开启画布滚轮缩放**/
    mousewheel: {
      enabled: true,
      modifiers: ['ctrl', 'meta']
    },
    grid: {
      size: 10, // 网格大小 10px
      visible: true, // 绘制网格,默认绘制 dot 类型网格
      type: 'doubleMesh',
      args: [
        {
          color: '#E7E8EA',
          thickness: 1
        },
        {
          color: '#CBCED3',
          thickness: 1,
          factor: 5
        }
      ]
    },
    panning: false,
    interacting: {
      nodeMovable: true,
      edgeMovable: true,
      magnetConnectable: false
    },
    highlighting: {
      magnetAvailable: {
        name: 'stroke',
        args: {
          padding: 4,
          attrs: {
            strokeWidth: 4,
            stroke: '#6a6c8a'
          }
        }
      }
    },
    connecting: {
      connector: {
        name: 'rounded'
      },
      router: {
        name: 'er',
        args: {
          offset: 25
        }
      }
    }
  })

  /**引入画布滚动插件**/
  graphRef.value.use(
    new Scroller({
      enabled: true,
      pageVisible: false,
      pageBreak: false,
      pannable: true,
      autoResize: true,
      autoResizeOptions: {
        border: 20
      }
    })
  )
  //graphRef.value.lockScroller()
  /**引入对齐线插件**/
  graphRef.value.use(
    new Snapline({
      enabled: true
    })
  )
}

const initing = ref(false)
const initDrawer = async (
  data: Array<ApiDataStructure.ERDataTable>,
  relation: Array<ApiDataStructure.ERDataRelation>
) => {
  console.log('initDrawer::', data, relation)
  if (initing.value) return
  initing.value = true
  try {
    if (graphRef.value) graphRef.value?.clearCells()
    else await initGraph()
    if (!graphRef.value) return
    if (!data?.length) {
      emptyFlag.value = true
      return
    }
    emptyFlag.value = false
    if (relation?.length > 0) {
      let temp = []
      for (let i = 0; i < relation.length; i++) {
        for (let j = 0; j < data.length; j++) {
          if (relation[i].resourceDbTableId === data[j].tableId) {
            //判断temp中是否已存在该表,若不存在则增加
            let flag = false
            for (let k = 0; k < temp.length; k++) {
              if (temp[k].tableId === data[j].tableId) {
                flag = true
                break
              }
            }
            if (!flag) {
              temp.push(data[j])
            }

            data.splice(j, 1)
          } else if (relation[i].relationTableId === data[j].tableId) {
            //判断temp中是否已存在该表,若不存在则增加
            let flag = false
            for (let k = 0; k < temp.length; k++) {
              if (temp[k].tableId === data[j].tableId) {
                flag = true
                break
              }
            }
            if (!flag) {
              temp.push(data[j])
            }
            data.splice(j, 1)
          }
        }
      }
      //合并temp数组和data数组
      data = temp.concat(data)
    }

    /**根据图表关系对原始表进行重新排序,使得有关系的表尽可能放在一起**/
    const cells: Cell[] = []
    const totalArea = initTotalArea(data)
    initSourceData(
      graphRef.value as any,
      cells,
      data,
      relation,
      Math.sqrt(totalArea)
    )
    graphRef.value.resetCells(cells)
    graphRef.value.use(new Export())
    graphRef.value.on('scale', ({ sx }) => {
      scale.value = sx
      dataStructureStore.updateScale(sx)
    })
    zoomGraph(dataStructureStore.scale)
    graphRef.value.centerContent()
  } catch (error) {
    console.log(error)
  } finally {
    initing.value = false
  }
  console.log('cells::', graphRef.value?.getCells())
}

const zoomGraph = (val: number | undefined) => {
  if (isNumber(val)) {
    graphRef.value?.zoomTo(val, {
      center: { x: 0, y: 0 }
    })
  }
}

/**
 * 导出E-R图
 */
const exportErmap = () => {
  downloading.value = true
  let fileName =
    systemStore?.systemInfo?.code +
    '_' +
    systemStore?.versionInfo?.version +
    '_' +
    props.resourceDbName +
    '_ER图'

  const area = graphRef.value?.getContentArea()
  try {
    graphRef.value?.exportJPEG(fileName + '.jpeg', {
      width: area?.width || 0,
      height: (area?.height || 0) * 1.1,
      quality: 1,
      padding: 10,
      copyStyles: false,
      backgroundColor: '#ffff',
      stylesheet: `.of-ergraph-group {
  transform:scale(0.96);
  display: flex;
  flex-direction: column;
  background: #fff;
  width: 236px;
  border-radius: 8px;
  border: 0 solid #1890ff;
  border-top-width: 8px;
  box-shadow: 0 0px 12px 2px rgba(0, 0, 0, 0.1);
  margin-left: -8px;
}
.of-ergraph-group .ergraph-group-header {
  white-space: nowrap;
  text-align: center;
  padding: 8px 24px;
  font-size: 13px;
  line-height: 20px;
  border-bottom: 1px solid #ddd;
  overflow: hidden;
  /*超出隐藏*/
  text-overflow: ellipsis;
  /*文字超出时显示省略号*/
  background-color: rgba(250, 250, 251, 0.8);
}
.of-ergraph-group .ergraph-group-list {
  flex: 1;
  list-style: none;
  overflow: auto;
  padding: 5px 3px 3px 3px;
  margin: 0;
  overflow: hidden;
  box-sizing: border-box;
}
.of-ergraph-group .ergraph-group-list li {
  font-size: 12px;
  line-height: 16px;
  padding: 5px 5px;
  border-radius: 3px;
  transition: all 0.3s;
  cursor: pointer;
  box-sizing: border-box;
}
.of-ergraph-group .ergraph-group-list li:hover {
  background: #f2f6fc;
}
.of-ergraph-group .ergraph-group-list li .ergraph-group-tips {
  float: right;
  margin-left: 10px;
  color: #999;
}
.of-ergraph-group .ergraph-group-list li .ergraph-group-text {

  display: inline-flex;
  padding-left: 5px;
  width: 120px;
  overflow: hidden;
  text-overflow: ellipsis;
  white-space: nowrap;
}
.el-icon {
    --color: inherit;
    height: 1em;
    width: 1em;
    line-height: 1em;
    display: inline-flex;
    justify-content: center;
    align-items: center;
    position: relative;
    fill: currentColor;
    color: var(--color);
    font-size: inherit;
}
.of-ergraph-group .ergraph-group-list li .ergraph-group-text .primaryImg {
  float: left;
  width: 7px;
  height: 7px;
  margin-right: 5px;
  margin-top: 5px;
}
.of-ergraph-group .ergraph-group-list li .ergraph-group-text .icon-require {
  margin-top: 2px;
  width: 14px;
  height: 14px;
}

.of-ergraph-group .ergraph-group-list li .ergraph-group-text .field{
  overflow: hidden;
  text-overflow: ellipsis;
  white-space: nowrap;
}
`
    })
  } catch (error) {
    ElMessage.error('导出失败')
  } finally {
    setTimeout(() => {
      downloading.value = false
    }, 2000)
  }
}
/**保存ER图 */
const saveErmap = () => {
  /**保存页面graph为JSON格式 */
  let entityPositions: Array<ApiDataStructure.tablePositions> = []
  graphRef.value?.toJSON().cells.forEach((item: any) => {
    if (item.shape === 'custom-vue-node') {
      entityPositions.push({
        tableId: item.id,
        tablePosition: JSON.stringify(item.position)
      })
    }
  })

  saveOrUpdateErDiagramApi({
    resourceDbId: props.resourceDbId,
    tablePositions: entityPositions
  }).then((res) => {
    console.log(res)
    ElMessage.success('操作成功')
  })
}
/* E-R图显示设置,设置更新时 */
const graphSettingDialog = reactive<{
  visible: boolean
}>({
  visible: false
})
const graphSetting = reactive<ApiDataStructure.ErGraphSetting>({
  titleDisplay: 'only_tableName',
  fieldDisplay: 'only_columnName',
  fieldNumDisplay: 'default_10_first'
})
const hanldeErGroupSetting = () => {
  graphSettingDialog.visible = true
}
const handleSaveSetting = (newSetting: ApiDataStructure.ErGraphSetting) => {
  // graphSettingDialog.visible = false
  graphSetting.fieldDisplay = newSetting.fieldDisplay
  graphSetting.titleDisplay = newSetting.titleDisplay
  graphSetting.fieldNumDisplay = newSetting.fieldNumDisplay
  graphSettingDialog.visible = false

  initDrawer([...props.sourceData], [...props.relationData])
  // emiter.emit('ER_GRAPH_SETTING_UPDATED', graphSetting)
}
const onZoom = (val: number) => {
  zoomGraph(val)
}

const onZoomOut = (val: number) => {
  zoomGraph(val)
}

const onZoomFit = () => {
  if (!graphRef.value) return
  // 获取画布宽度
  //const drawerRect = containerRef.value?.getBoundingClientRect()
  const VIEWBOX_WIDTH = ergraphWrapper.value?.clientWidth || 0
  const oldWidth = graphRef.value.getContentArea().width || 0
  const percent = VIEWBOX_WIDTH / (oldWidth + 100)
  zoomGraph(percent > 1.6 ? 1.6 : percent)
  const { x, y } = graphRef.value.getContentArea()
  graphRef.value.positionPoint({ x, y }, 10, 10)
}

const isFullscreen = ref(false)
const onFullScreen = () => {
  if (!screenfull.isEnabled) {
    ElMessage.warning('该浏览器不支持全屏!!')
    return false
  }
  // if (isFullscreen.value === false) {
  //   scrollLeft = graphPosition?.left
  // }
  if (!screenfull.isFullscreen) {
    //NODE_WIDTH 每个元素宽度
    isFullscreen.value = true
    // if (graphPosition) {
    //   graphRef.value?.setScrollbarPosition(
    //     graphPosition?.left -
    //       (columns / 2 - 1) * (NODE_WIDTH + NODE_OFFSET + NODE_WIDTH / 2),
    //     graphPosition?.top
    //   )
    // }
    screenfull.request(document.querySelector('#drawer')!)
    dataStructureStore.updateScale(1.0)
  } else {
    isFullscreen.value = false
    // graphRef.value?.setScrollbarPosition(
    //   graphPosition?.left,
    //   graphPosition?.top
    // )
    //graphRef.value?.setScrollbarPosition(viewbox_position.left)
    screenfull.exit()
  }

  screenfull.on('change', () => {
    if (screenfull.isEnabled && !screenfull.isFullscreen) {
      isFullscreen.value = false
      //console.log(containerRef.value?.getBoundingClientRect())
      //containerRef.value?.getBoundingClientRect().x
      //graphRef.value?.setScrollbarPosition(24)
    }
  })
}

const showAll = computed(() => graphSetting.fieldNumDisplay === 'both_all') // 是否显示全部字段// 是否显示全部字段
watch(
  () => [props.sourceData, props.relationData],
  async () => {
    const { data } = await getErConfig(props.resourceDbId)
    graphSetting.fieldDisplay = data?.fieldDisplay || 'only_columnName'
    graphSetting.titleDisplay = data?.titleDisplay || 'only_tableName'
    graphSetting.fieldNumDisplay = data?.fieldNumDisplay || 'default_10_first'
    initDrawer([...props.sourceData], [...props.relationData])
    // emiter.emit('ER_GRAPH_SETTING_UPDATED', graphSetting)
  },
  {
    immediate: true,
    deep: true
  }
)

onMounted(() => {
  scale.value = dataStructureStore.scale
  // fix antv/x6 vue teleport issue: https://github.com/antvis/X6/issues/3542
  resetTeleport()
})
</script>
<style lang="scss" scoped>
.of-ergraph {
  position: relative;
  display: flex;
  width: 100%;
  min-height: 200px;
  flex: 1;

  .ergraph-container {
    flex: 1;
  }

  .ergraph-minimap {
    position: absolute;
    top: 10px;
    right: 10px;
  }
}
#drawer {
  margin: 0 auto;
}
.empty {
  display: flex;
  justify-content: center;
  align-items: center;
  width: 100%;
  color: rgba(0, 13, 31, 0.45);
  font-size: 13px;
}
</style>
teleport.ts
// to fix antv/x6 vue teleport issue: https://github.com/antvis/X6/issues/3542
import { defineComponent, h, reactive, Teleport, markRaw, Fragment } from "vue";
import { Graph } from "@antv/x6";
import { VueShape } from "@antv/x6-vue-shape";

let active = false;
const items = reactive<{ [key: string]: any }>({});

//向items插入原数据对象
export function connect(
  id: string,
  component: any,
  container: HTMLDivElement,
  node: VueShape,
  graph: Graph
) {
  if (active) {
    items[id] = markRaw(
      defineComponent({
        render: () =>
          h(Teleport, { to: container } as any, [
            h(component, { node, graph }),
          ]),
        provide: () => ({
          getNode: () => node,
          getGraph: () => graph,
        }),
      })
    );
  }
}

export function disconnect(id: string) {
  if (active) {
    delete items[id];
  }
}

export function isActive() {
  return active;
}

//遍历渲染items中的数据
export function getTeleport(): any {
  active = true;

  return defineComponent({
    setup() {
      return () =>
        h(
          Fragment,
          {},
          Object.keys(items).map(id => h(items[id]))
        );
    },
  });
}
// 清空teleport
export function reset() {
  active = false;
  for (const key in items) {
    delete items[key];
  }
}
注意:自定义 vue 节点虽然可以使得 E-R 图实体和连线 UI 样式更灵活可配置,但是在 E-R 图导出时,会引起自定义样式丢失的问题,导致导出内容混乱,在查询了很多资料后,最终使用最新版 antv 的官方导出插件中 stylesheet 设置自定义导出格式,这个工具只支持 css3 格式的样式导出。另外,导出大量数据图时,导出文件清晰度和整个画布的大小及宽高比设置有关,需要动态计算一个宽高合适的导出比例和大小再导出高清图。